Introduction
There are so many excellent open-source initiatives today that it’s hard to keep track of everything what’s being, or already has been, developed. There’s a good chance that if you’re looking for a specific application you’d be able to find at least in part what you’re looking for. It’s wonderful to have this huge and dedicated community spending hours on open-source software. Today it’s my turn to make a small contribution, CoolPanel. It may be especially of interest for those working in thermodynamics for example in HVAC, or chemical industry.
What is CoolPanel
CoolPanel is the start of a thermodynamics application, combining powerful and feature rich technologies available today. It is written in Python, and consists of a combination of several open source modules:
– Holoviz Panel, a library to streamline the development of complex applications and dashboards. It allows for writing feature rich user interfaces to underlying Python modules.
– CoolProp, a thermodynamics library written in C++ with interfaces to just about any popular programming language, including as a Python module.
– Fluprodia, a pure Python module generating diagrams using CoolProp as calculation engine.
In this setup, Panel serves as the user web interface front-end and CoolProp as calculation back-end with Fluprodia in between, generating the plot data. CoolPanel itself doesn’t add new functionality to any of these modules, just uses them to form a user application, making the functionality in CoolProp available in a graphical interface. There’s an online demo version of CoolPanel available which features only the single component diagram tab. A more comprehensive version is available on Github. This is the development version and will see regular updates. As such CoolPanel is a small start of a technology demonstration project, but it is easy to see how it can be extended in many directions, offering accessibility to a widely applicable and complex area of science.
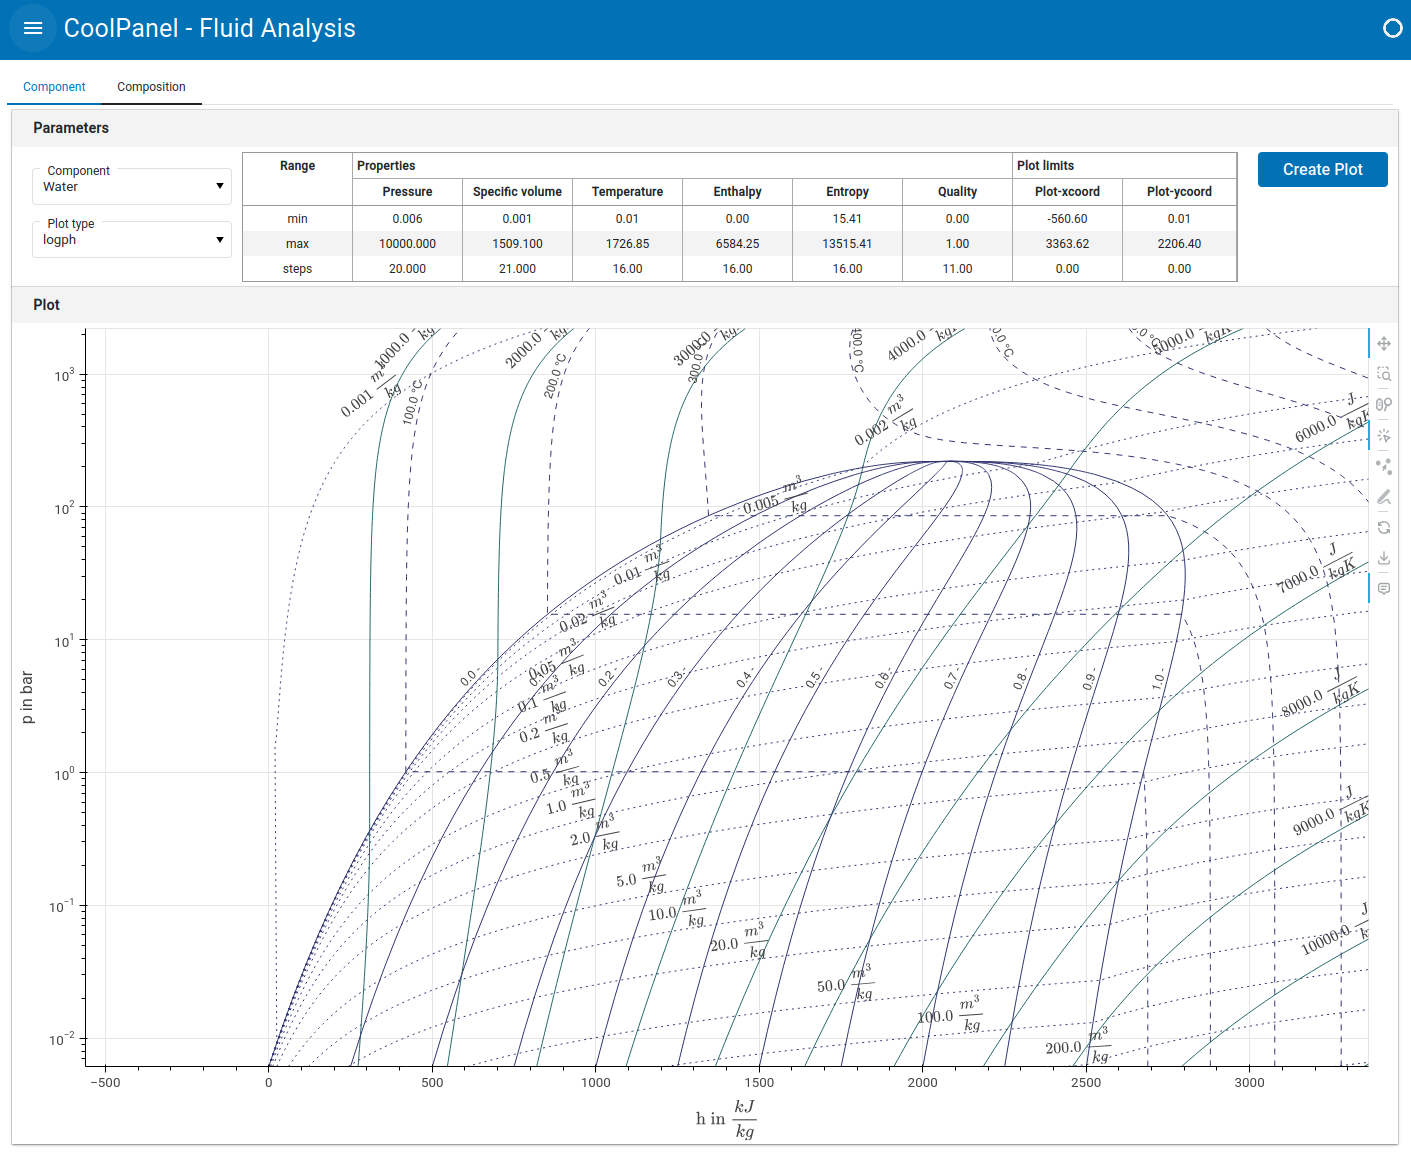
The single component and mixtures thermodynamic diagrams presented are between the properties pressure (p), temperature (T), enthalpy (h), entropy (s) and specific volume (v) (=inverse of density). Multiple isolines are plotted for various quality values (Q) ranging from 0.0 (100% liquid) to 1.0 (100% gas) and level values for the properties not on the x- or y-scale.
This initial release of CoolPanel can only been seen as a very modest application, though it does combine a number of very interesting functionalities. Using Holoviz Panel will make it a web based application, i.e. user interface access via a web page. It is easily accessible and extensible, and can be served up through PyScript or Pyodide, a Python distribution for browsers, based on WebAssembly. Holoviz Panel can compile an application into PyScript/Pyodide worker.
A CoolPanel demo is available here. In the demo, only the thermodynamic diagrams for single components are made available. Extended functionality is available in the Github scripted version.
How CoolPanel works
The demo version, available as a web application has one tab named ‘Component’. On this tab, a component and plot-type can be selected. After selection press ‘Plot’ to have the plot created. The ranges used are displayed in the table, where the ‘Properties’ ranges refer to the ranges in which the properties have been varied, and the ‘Plot limits’ show the x- and y-range used for the plot. These ranges can be adjusted, after hitting the ‘Plot’ button will use the new ranges delimit the range between which rounded values will be generated for the level values of the parameters not on the x- or y-axis). This means that for example on log scale, values will be like 0.1, 1.0, 10 ,100 ..etc).
The Github version of CoolPanel has another tab ‘Composition’. In the upper section of this tab, a mixture can be created, selecting a component from the list and the mole fraction of this component. Click on ‘Add’ to add the selection to the mixture. Components already added can be selected through the checkbox on the entry and hitting the ‘Delete’ button. The mixture can normalized (mole fractions adding up to 1.0) with the ‘Normalize’ button. The mixture table can in it’s entirety be downloaded.
To create a plot, the plot type can be selected and the Equation of State to be used to generate the plot. Mind that in this plot, only the phase envelope will be plotted, i.e. the liquid (red) and vapor (blue) lines. Also the stable critical point(s) will be plotted if they can be found.
What’s next
The CoolProp library itself is very useful in many other applications. It has to be mentioned that calculating the flash results of complex mixtures can be very difficult, and some verification of the robustness of these calculations is advised. A next extension to CoolPanel could for example access more functionality available in CoolProp, and possibly an optimization module to match pseudo components to experimental data. Should you be interested in any particular functionality, please let me know in the comments.